
Navigating the intricate labyrinth of modern enterprise technology often feels like managing a dozen different languages simultaneously, especially when critical data is scattered across legacy on-premises servers and ephemeral cloud instances. For years, IT administrators have grappled with a fragmented ecosystem where network performance, server health, and application metrics existed in isolated silos, requiring constant context switching and manual correlation. The arrival of SolarWinds Observability Self-Hosted, or SWOSH, represents a strategic pivot toward a unified monitoring paradigm that emphasizes visibility without the inherent complexities of traditional disjointed software suites. By consolidating these formerly separate management functions into a single pane of glass, organizations can maintain strict control over sensitive data within their own data centers while enjoying the sleek, integrated workflows once exclusive to cloud-native observability platforms. This shift is less about adding another tool and more about refining the operational strategy for stability.
Licensing Framework: The Shift to Node-Based Subscriptions
One of the most significant hurdles in scaling IT operations has historically been the unpredictable nature of software licensing, which often penalized growth through volume-based costs or complex sensor-specific pricing models. SWOSH addresses this financial friction by introducing a transparent, node-based subscription model that allows technical leadership to forecast budgets with newfound precision. The structure is divided into three tiers—Essentials, Advanced, and Premier—each designed to cater to different levels of environmental complexity and operational maturity. The Essentials tier provides a robust foundation, covering primary network performance and server health, which serves as an entry point for smaller enterprises or specific departments. Moving up to the Advanced tier unlocks sophisticated capabilities such as machine learning-driven anomaly detection and detailed network traffic analysis, providing the deeper insights necessary for managing modern, high-traffic infrastructures where manual oversight is no longer feasible.
Functional Hierarchy: Exploring the Subscription Tier Structure
For larger organizations or those managing dense data centers, the Premier tier introduces a value-based licensing philosophy that specifically targets the challenges of virtualized and containerized environments. In older systems, every individual virtual machine or container might consume a full license, quickly exhausting budgets and discouraging the adoption of modern, agile architectures. The SWOSH approach changes this dynamic by allowing multiple high-density resources to be monitored under a more flexible allocation system, ensuring that the cost of observability remains proportional to the actual business value being delivered. This tier also encompasses advanced features like web performance monitoring and automated incident response, creating a high-level safety net for mission-critical applications. By aligning software costs with physical and logical infrastructure nodes rather than data throughput, the platform removes the hidden success tax that often accompanies rapid digital expansion, enabling teams to scale easily.
Deployment Efficiency: Centralizing Management Through the Orion Console
The technical architecture of the platform is built upon the established reliability of the Orion web console, providing a familiar yet modernized interface that simplifies the initial deployment phase significantly. Instead of managing multiple separate installation routines for various monitoring modules, administrators can utilize a single, integrated installer that orchestrates the entire setup process. This streamlined approach drastically reduces the time to value, allowing IT teams to begin collecting data within hours rather than days of the initial implementation. However, the comprehensive nature of this observability suite necessitates a solid hardware foundation to maintain peak performance under heavy operational loads. To ensure the system remains responsive and capable of processing the vast amounts of telemetry data generated by modern networks, recommendations typically involve a minimum of 32GB of memory and a high-performance, dedicated SQL Server instance to handle the monitoring workload.
Hardware Standards: Ensuring Robust Foundation for Production Loads
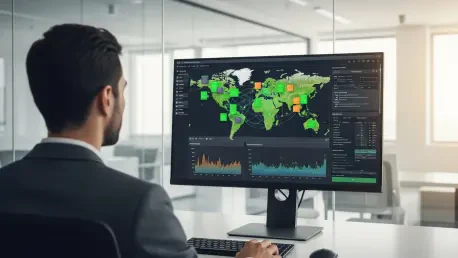
Once the core software is operational, the Discovery Central feature serves as the primary engine for mapping out the sprawling modern IT landscape across both local and remote locations. This automated tool uses standard protocols to scan the network and identify assets, ensuring that no server, switch, or storage array remains unmonitored or undocumented. Beyond local hardware, the discovery engine extends its reach into the major public cloud ecosystems, including Amazon Web Services, Microsoft Azure, and Google Cloud Platform. By pulling cloud-native instances and storage buckets into the same centralized dashboard as on-premises hardware, SWOSH effectively erases the visibility gap that often plagues hybrid environments. This unified view is essential for troubleshooting issues that span across multiple environments, such as a localized application server experiencing latency due to a misconfigured cloud database. Having all these disparate elements represented in a single map allows for a holistic view.
Intelligent Insights: Leveraging AIOps for Natural Language Queries
The integration of artificial intelligence into the monitoring workflow marks a departure from traditional reactive management, shifting the focus toward proactive insights and rapid problem resolution. Through the dedicated AIOps service, the platform provides a conversational interface that allows IT professionals to query their environment using natural language rather than complex filtering or manual data mining. An administrator can simply ask for a high-level summary of the most critical alerts across a specific region or request a health check on a particular cluster, and the AI will synthesize a concise response based on real-time data. This capability significantly lowers the barrier to entry for junior staff while providing senior engineers with a way to quickly triage emerging issues without getting bogged down in minutiae. By automating the correlation of disparate alerts and identifying patterns that might escape human observation, the AI engine helps reduce the overall noise within the system.
Diagnostic Precision: Utilizing NetPath and PerfStack for Troubleshooting
Complementing these AI insights are powerful diagnostic tools designed for deep-dive technical analysis, such as NetPath and PerfStack, which offer unprecedented visibility into network and application behavior. NetPath functions like a traceroute for the modern age, visualizing the entire network path from the internal source to external services, including every hop across the public internet. This allows teams to pinpoint exactly where latency is occurring, even if the problem lies within a third-party service provider’s infrastructure. Simultaneously, the PerfStack feature enables users to drag and drop different data types—such as CPU utilization, network throughput, and storage latency—onto a shared timeline to identify correlations between performance drops and specific events. Together, these tools provide a granular level of detail that is essential for resolving intermittent or complex issues that defy simple explanations. The platform ensures that the transition from identifying a problem is efficient.
Strategic Implementation: Consolidating Siloed Monitoring Infrastructure
Adopting this node-based monitoring framework required a clear understanding of the existing infrastructure needs and a commitment to maintaining high-performance hardware standards to support the unified platform. Organizations that successfully transitioned to this integrated model focused on consolidating their siloed tools into the tiered subscription levels that best matched their specific operational complexity. They prioritized the configuration of discovery protocols to ensure complete visibility across hybrid cloud environments and leveraged AI-driven insights to reduce the mean time to repair for critical service disruptions. Moving forward, technical leaders regularly audited their node allocations to optimize costs and ensure that high-density resources like containers were being monitored efficiently under the value-based model. It was also beneficial to train staff on utilizing advanced visualization tools like NetPath to handle the increasing complexity of cross-provider network paths accurately.
Future Readiness: Establishing Data-Driven Operational Baselines
Future-proofing the monitoring environment involved more than just software installation; it necessitated a cultural shift toward data-driven decision-making and collaborative troubleshooting across departments. Teams that maximized the benefits of the platform established internal benchmarks for performance using the integrated analytics, ensuring that every hardware upgrade or software patch was measured against a baseline of historical data. By utilizing the conversational AI interface, they democratized access to technical insights, allowing non-expert stakeholders to understand system health without requiring extensive training in database queries or network protocols. This comprehensive approach ensured that observability remained a central pillar of the organizational strategy rather than an afterthought. Ultimately, the transition to a self-hosted, unified system provided the necessary balance between robust data security and modern operational agility, paving the way for more resilient management.